Modeling Epidemics - First Steps with Agent-Based Modeling Pt. 2
02 Jan 2016We spent the last post discussing principles of agent based modeling, and the basic layout of the model I have initially created. Now it's time to see some results! All of the code used to generate this model can be found here.
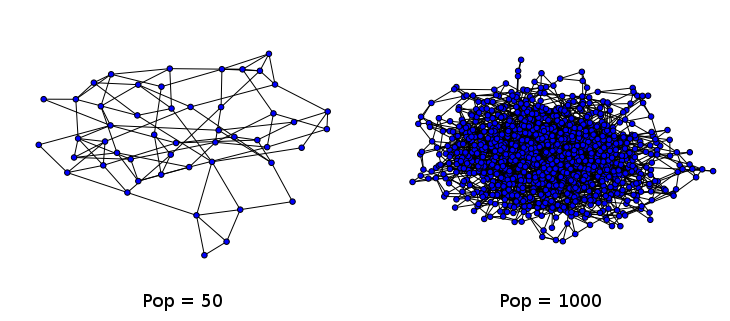
First off, I want to talk a bit about the approaches which I have taken towards the visualization of my model, as well as the inadequacies of these approaches. In the previous post, I discussed the fact that my model is based upon the usage of networks (graphs) for the mapping of social interactions. My first approach to visualization (particularly during the development process) was plotting these networks, as this allowed me to see how the disease was spreading in my model, and debug. This worked well during the testing phase, when my model population was rather small; however, when I scaled up the model, this technique did not work as well.
 Two example small world networks generated and drawn by the networkx library in Python. As the number of nodes increases, ease of interpretation decreases dramatically. The graph on the right is often referred to as a hairball.
Nonetheless, I have yet to find any better way of displaying the change in the nodes of my network over time. There are other software out there which are better suited to the display of graphs (and allow for greater interactivity), but I have yet to spend much time exploring them. I am particularly interested in two softwares: Gephi, which is a Java based software built for the purpose of both analyzing and visualizing graphs; and sigma.js, a browser-based Javascript library built for the purpose of visualization.
Network Animated GIFs
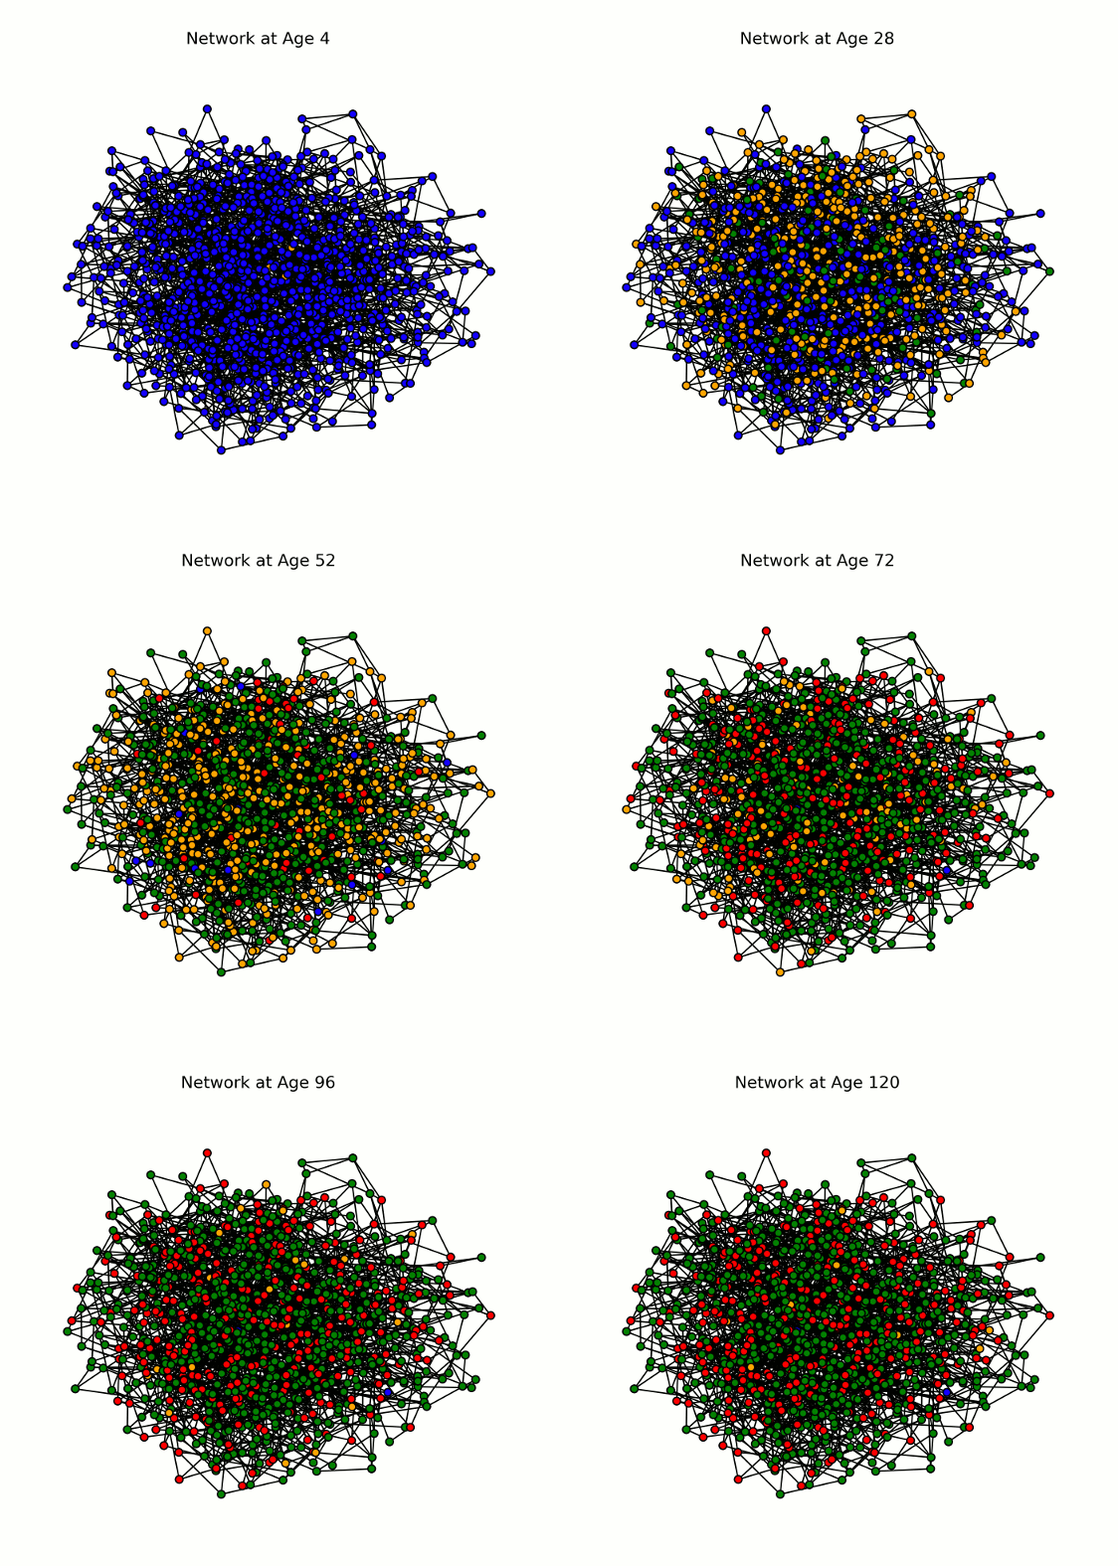
For now, I have harnessed a technique I have leveraged in a previous project in which I analyzed of US Senate data. I utilize the ImageMagick "convert" command-line tool in order to combine a series of static images into an animated gif (example here). For my network, I animate the nodes as they change color to indicate their infection state. The vizualization is a bit chaotic, but I think it looks real neat.
 Animation displaying the spread of the disease through the network (# nodes = 1000). Each node (or individual) can have one of four states for a given pathogen: susceptible (blue), infected (yellow/orange), recovered (green), or dead (red). Here we show a single pathogen system.
Graphing Disease Progression
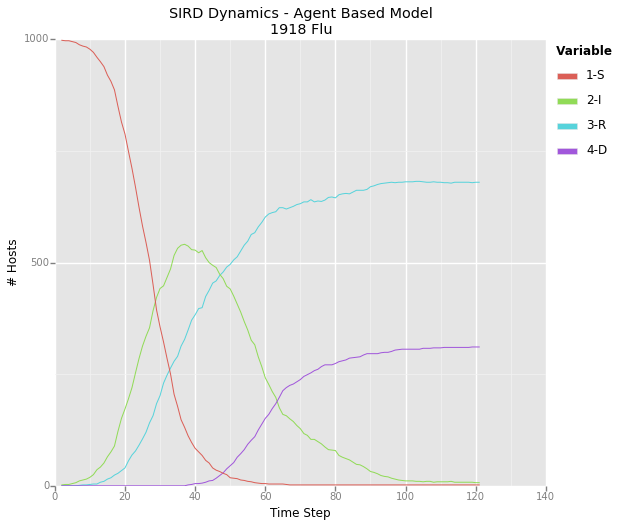
Though the animated network looks pretty cool, it doesn't tell us much about the quantitative dynamics of the disease. As such, I have the model create a graph of the SIRD dynamics for each pathogen present in the system (so far I've only tested single pathogen systems).
 A graph depicting the dynamics for a theoretical pathogen - I've taken to calling it the 1918 flu due to it's rapid spread and high mortality rate. This graph represents the same epidemic displayed in the above animated network.
Expected vs. Actual Results
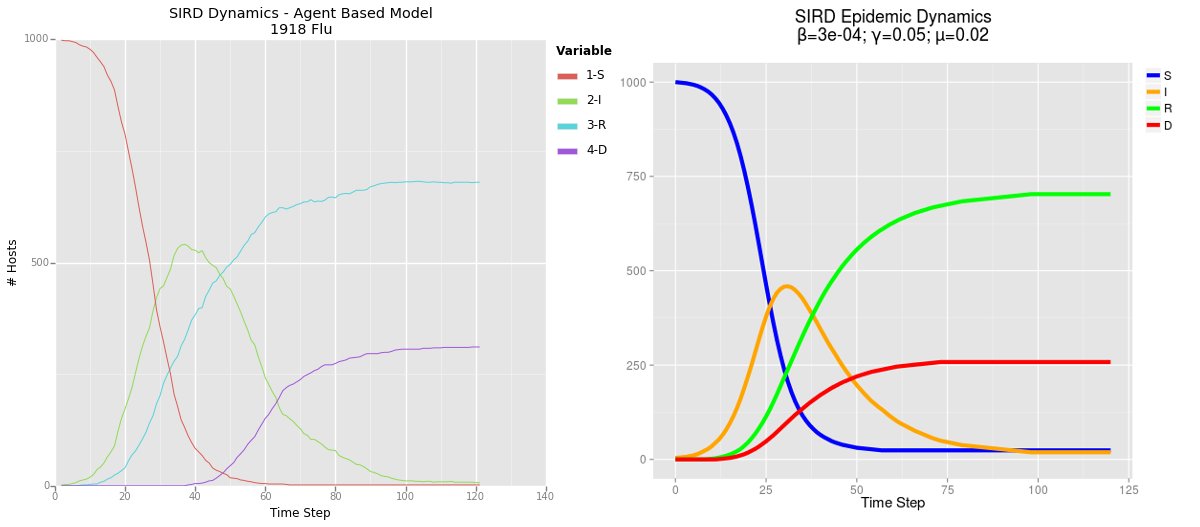
The fact that my model works at all is already pretty exciting, it was not an easy process to work out all the bugs, but what was more interesting was how closely the model mirrored the dynamics which I derived from my mathematical models. This indicates to me that my agent based model has some degree of predictive validity!
 Comparison of results from my agent based model (ABM) on the left and mathematical model on the right. Click to enlarge.
Next Steps
Now that I feel I've got a hang of the basics of ABM, I've got some real thinking to do. The value of these models is lies in their predictive potential, however I'm not sure exactly which questions I should be asking and trying to predict the answers to. My first impulse has been to explore the internet for epidemic datasets, which I can use as the basis for a predictive model. It's good to have some sort of empirical data behind any given model, both as a point of comparison, as well as a guide for modeling a real-world system.
I think the biggest thing that my current model lacks is the incorporation of spatial data: clearly the real world is not a flat plane, and there are a number of geographical features which can greatly impact disease transmission. My current thoughts on approaching this issue involve the use of real-world GIS data, as a means of determining population density and movement. In a model of human interactions, it may also be important to incorporate physical objects with which hosts can interact. Inanimate objects (known as fomites) are quite capable of transmitting pathogens, and this sort of interaction may be completely unrelated to social networks.
Ultimately the direction I will take in continuing this research will depend on the questions I am attempting to answer. If you have any ideas of how I can continue this work, feel free to drop them in the comments section. If you're interested in collaborating with me on this research, please feel free to get in contact. Thanks for reading!